The economics of data has a strong impact on the development of data-driven business opportunities. For instance, data can be consumed an unlimited number of times without losing its value, and it can be reused as input for the production of different goods and services. However, its value still depends on complementary assets related to the capability to extract information out of the data (OECD 2015).
Given the mentioned economic properties, disruptions through data are becoming more likely. In particular, due to network effects as well as the simplicity of how a variety of offerings with different value/price tags can be brought to the market, the success of data-driven innovation requires continuous alignment between the needs on the demand side and the opportunities on the supply side.
So how can data-driven business opportunities be screened? The data economy in general is a highly dynamic market. This is supported by the rapid growth of the European data markets, as well as recent technical breakthroughs that were made possible by the availability of large volumes of data, such as the Jeopardy demo by IBM Watson or Google Now or Siri. In addition, experts continue to highlight the wide range of commercial opportunities that can be realised by using the technologies available today.
Entrepreneurs bring new offerings to the market and should continuously scan the market’s offerings to identify promising available technology components that can be reused to speed up the development time of their innovation. At the same time, although they are confronted with the highly dynamic market, they have to constantly investigate their own unique selling point and the competitiveness of their offering. To stay competitive in this fast-moving market, entrepreneurs need to continuously reassess what is part of their core offering and in which areas they are partnering with others.
The high-growth scenario in the comprehensive European data market study (European Commission & Open Evidence 2017) is based on supply-demand dynamics that shift from technology push to demand pull. In other words, any means that provides guidance in match-making between market needs on the demand side and technical capabilities on the supply side helps to stimulate the development of data-driven innovation and in consequence the growth of the European data market.
To summarise, data-driven business opportunities should be described with a clear scope of offering per market segment (supply side) and reflect the ecosystem dynamics and benefits of network effects (demand side). In the next section, we present a high-level overview of the data-driven innovation framework which guides innovators to systematically explore and analyse the supply and demand sides of data-driven business opportunities by incorporating the particularities of data.
The Data-Driven Innovation Framework
The data-driven innovation (DDI) framework addresses the challenges of identifying and exploring data-driven innovation in an efficient manner. It guides entrepreneurs in scoping promising data-driven business opportunities by reflecting the dynamics of supply and demand through investigating the co-evolution and interactions between the scope of the offering (supply) and the context of the market (demand) in a systematic manner.
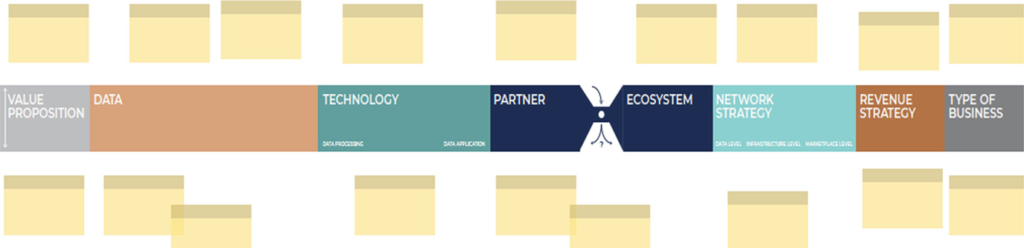
The DDI framework is based on a conceptual model in the form of an ontology with a set of categories and concepts describing all relevant aspects of data-driven business opportunities. Its categories are divided into supply side and demand side aspects. On the supply side the focus is on the development of new offerings. For a clearly defined value proposition, this includes the identification of and access to required data sources, as well as the analysis of underlying technologies. On the demand side the focus is on the dynamics of the addressed markets and associated ecosystems. The analysis includes the development of a revenue strategy, a way forward in how to harness network effects as well as an understanding of the type of business. As data-driven innovations are never done in isolation, the identification and analysis of potential development partners as well as partners in the ecosystem help to align/balance the supply and demand aspects in such a way that their competitive nature will stand out. Figure 1 illustrates the DDI Canvas that covers eight central dimensions to be explored when scoping data-driven innovation.
The DDI framework was developed and tested in the context of the Horizon 2020 BDVe project and is backed by empirical data and scientific research encompassing a quantitative and representative study of more than 90 data-driven business opportunities. The results of the research study guided the fine-tuning and updating of the DDI framework and helped to identify success patterns of a successful data-driven innovation.Currently the DDI framework is used to run workshops for projects of the BDV Public-Private Partnership, data-driven start-ups and SMEs, and with corporates. It consists of:
- DDI Canvas guiding users in exploring all relevant dimensions on the supply and demand sides of a data-driven innovation in a systematic manner.
- DDI Navigator and methods that support users in exploring each dimension at the required level of detail by investigating the aspects mentioned by guiding questions as well as by applying complementary methods.
- Specific DDI Tools will help the user to work through each of the eight DDI dimensions, producing a conclusive set of results that will guide a company-specific setup of new, data-based products and services.
Examples of Success Stories
In the following section, we provide some examples of success stories of the aforementioned research study of data-driven start-ups to give the reader an impression of how clearly and precisely their supply and demand sides can be pitched.
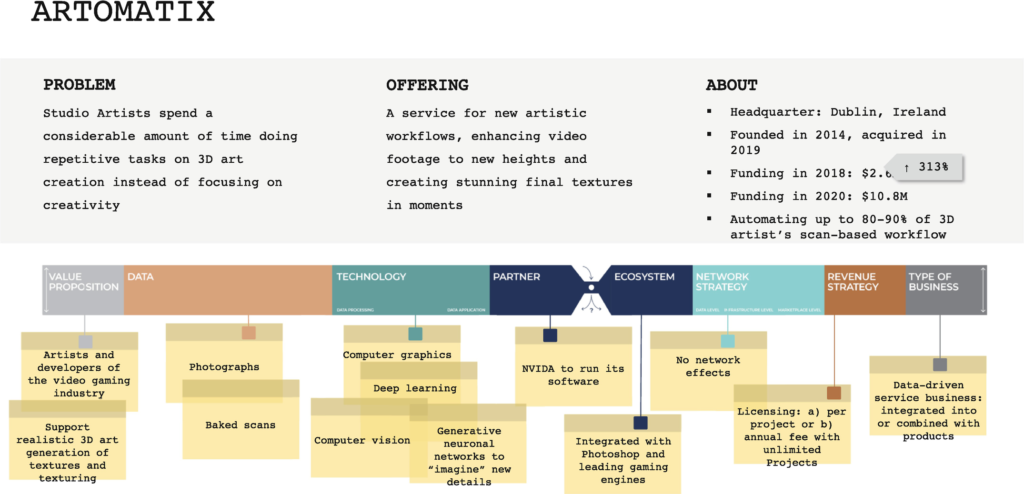
Artomatix is a Dublin-based software company founded in 2014 that uses artificial intelligence to create realistic 3D art creations.
Artomatix’s users are artists and developers of the video gaming industry that can benefit from a service that supports the realistic 3D art generation of textures and texturing. Previously, this tedious task was done manually but with the suite of tools provided by Artomatix, artists can now do the same task ten times faster.
The technology is based on computer graphics, Deep Learning and computer vision. It uses generative neuronal networks to “imagine” new details of a texture in a way a human would, i.e. it recognises objects in a video and can add texture and features automatically by relying on the “learned” knowledge that should be there.
The data used for training and developing the algorithm is video and image data. The software can be integrated with Photoshop and leading gaming engines like Unity and Unreal.The company uses three different subscription models (Indie (revenue < $100 K/year), Professional (revenue < $1 M/year) and Enterprise (revenue > $1 M/year)). Enterprises can license Artomatix’s technology and build it into their existing process for an annual fee. The technology is offered as a data-driven service. There are no network effects that need to be reflected. A short summary is provided in Fig. 2.
Selectionnist
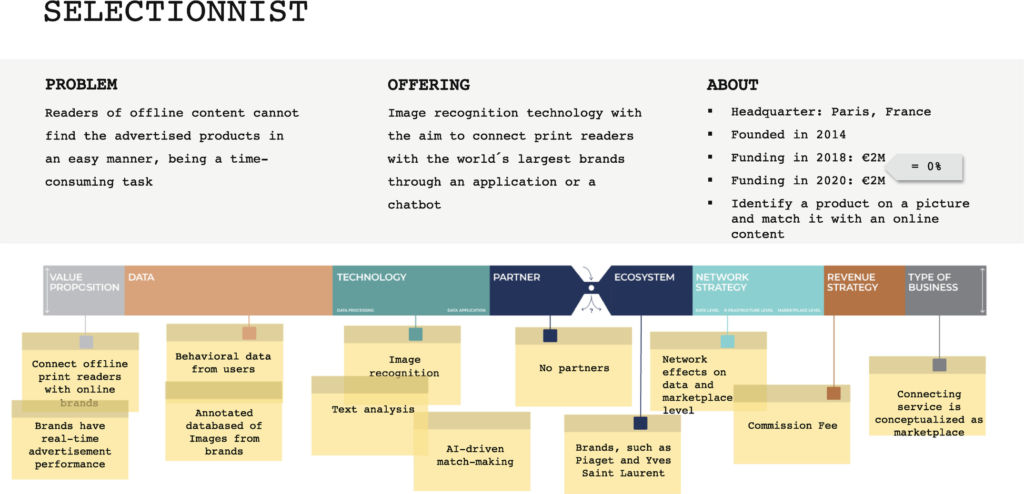
Selectionnist is a France-based company founded in 2014 offering image recognition technology with the goal of connecting readers of print journals with the world’s largest brands through an application or a chatbot. They aim to bridge the gap between offline content and online experience by offering an advanced match-making service to connect consumer and brands.They address two different customer groups with different value propositions:
- Value proposition for consumer: they locate and potentially purchase a product they spot in a magazine just by snapping a picture of it.
- Value proposition for brands: brands can see in real time how readers interact with their editorial and advertising in print magazines.
Selectionnist’s match-making algorithm is based on image recognition technology that continuously improves the images of brands’ products in their databases (more brands) and the user request they receive. Thus, their offering is based on network effects on data level. The service is conceptualised as marketplace based on commission fee and with network effects on marketplace level. A short summary of the above explanations is provided in Fig. 3.
Arable
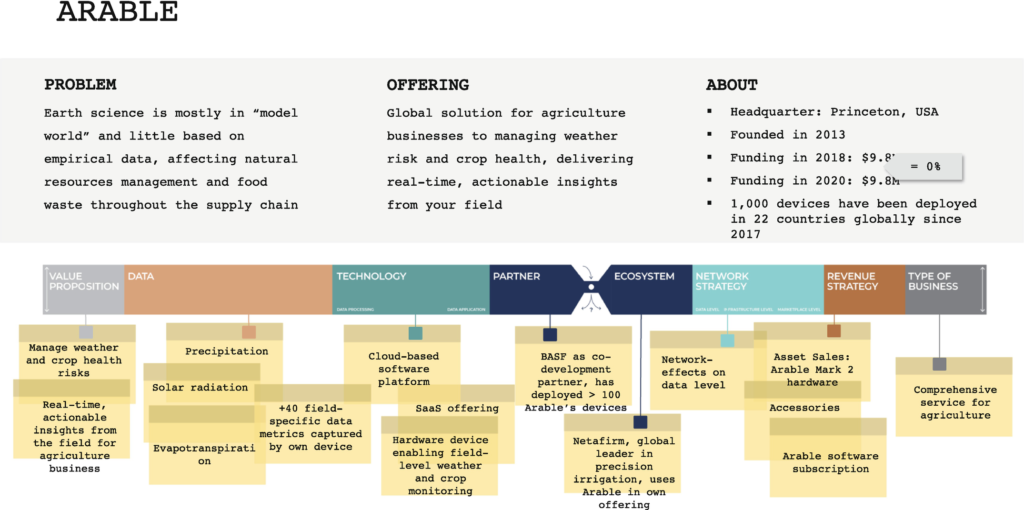
Arable is a US-based company founded in 2013 offering agriculture businesses a global solution for managing weather and crop health risks, delivering real-time, actionable insights from the field.
The target users are growers, advisors and businesses who aim to play a proactive role in the quality and longevity of their operations.
The agricultural business intelligence solution is based on in-field measurements allowing the production of real-time continuous visibility and predictive analytics in the areas of crop growth, harvesting time, yield and quality. The solution relies on field-level weather and crop monitoring devices (hardware that is part of the solution) that collect over 40 field-specific data metrics. To enable access to data from anywhere in real time, a cloud-based software platform based on a tiered SaaS offering (different levels of services) is combined with IoT hardware.Arable sells licences for enterprise software to agribusinesses. As the prediction service improves with more data available, the solution of Arable is based on network effects on a data level. Figure 4 summarises the above-described findings.
Excerpt from: Zillner S. (2021) Business Models and Ecosystem for Big Data. In: Curry E., Metzger A., Zillner S., Pazzaglia JC., García Robles A. (eds) The Elements of Big Data Value. Springer, Cham. https://doi.org/10.1007/978-3-030-68176-0_11
References:
- OECD. (2015). Data-driven innovation: Big data for growth and well-being. OECD digital economy papers, p. 456. https://doi.org/10.1787/9789264229358-en
- European Commission, (IDC), I. D. C., & Open Evidence. (2017). Final results of the European Data Market study measuring the size and trends of the EU data economy.